


In this newsletter we explore 18 Years of UK Faster Payments transactions plus forecasts to 2030 with a guest blog from Jeremy Light - huge thanks to Jeremy for allowing Payments:Unpacked to feature this guest blog.
Be sure to subscribe to Jeremy’s excellent Agenda: Payments newsletter at:
18 Years of UK Faster Payments Transactions plus Forecasts to 2030
The UK’s Faster Payments system (FPS) turns eighteen this year. In recognition, last week I outlined how FPS developed and this week I cover the story of its transactions since 2008, with forecasts to 2030.
Real-time payment systems like FPS are common today but prior to 2008 there were none. Few bankers at the time believed there was much need for real-time, a view that still persists in some quarters today, the world-over. Europe, for example had to introduce legislation last year to force banks to provide real-time payments.
The FPS statistics show the doubters were (and are) mistaken - FPS stepped into the unknown at launch and discovered quickly it had tapped into a rich seam of hidden consumer and business demand, creating a new way of paying that has changed banking forever.
Faster Payments Transactions
Faster Payments has four transaction types:
Single Immediate Payments (SIPs) are real-time payments, usually submitted anytime 24/7 through online and mobile banking (including using open banking). SIPs are synchronous and start and end with directly connected participants. Indirect participants initiate and receive SIPs through their sponsoring direct participant (indirect access provider).
Standing Order Payments (SOPs) are recurring payments for subscriptions, rent, mortgage payments etc. SOPs are asynchronous payments, submitted by banks via batch processing overnight after midnight and before the start of day on business days, with 90%+ submitted before 6 am. Once submitted, they are credited immediately to the beneficiary. It may seem odd to submit batch files into a real-time engine but this was a key driver for FPS. Previously, standing orders were submitted through Bacs causing a three-day+ delay between the payer account debit and payee account credit.
Forward Dated Payments (FDPs) are asynchronous payments held by the payer’s bank to submit at a date in the future. The payer’s bank can choose to submit the payment at any time on the due date (e.g. to help smooth intraday liquidity) but are expected to submit them with SOPs (if a SOP submitter). FDPs are targeted at business payments and feature on business banking apps e.g. to schedule payments up to 31 days ahead.
Returns are separate payments that reference a previous SIP payment that is being returned e.g. because an account is closed or frozen and the receiving bank/PSP is unable to credit the original payment to it. The decision to initiate a return is a bank/PSP decision based on their policies rather than on FPS rules. Additionally, the central infrastructure initiates returns for asynchronous payments (SOP, FDP), including those submitted by corporates using DCA (direct corporate access), that a participant has received and rejected.
Each of these different FPS transaction types are processed in the same central infrastructure and they all require sufficient pre-funding in the sending institution’s settlement account to clear. The scheme rules for each are different, for example for acceptance into processing and for prioritisation (SIPs are usually highest priority).
Volumes and Value History
After the 2008 launch, most of the payments through Faster Payments were SOPs. Banks simply began diverting SOPs from submission to the BACS system to FPS. However, demand for SIPs was strong right from the start. There were 36m SIPs in 2008 in the seven months after launch followed by 109m SIPs in 2009 compared to 157m SOPs. SIPs volumes were 380m in 2012 sailing past SOP volumes at 300m and ever since SIPs have been the dominant transaction type. In 2025, SIPs accounted for 87% of all FPS payments and outnumber SOPs by a factor 12.
The volume history of all payment types, apart from returns (just 0.1% of the 2025 total), is shown in Figure 1 with a forecast to 2030. Since 2009, total FPS volumes have grown at a CAGR of 20%. Within this, SIPs have grown with a CAGR of 27%.
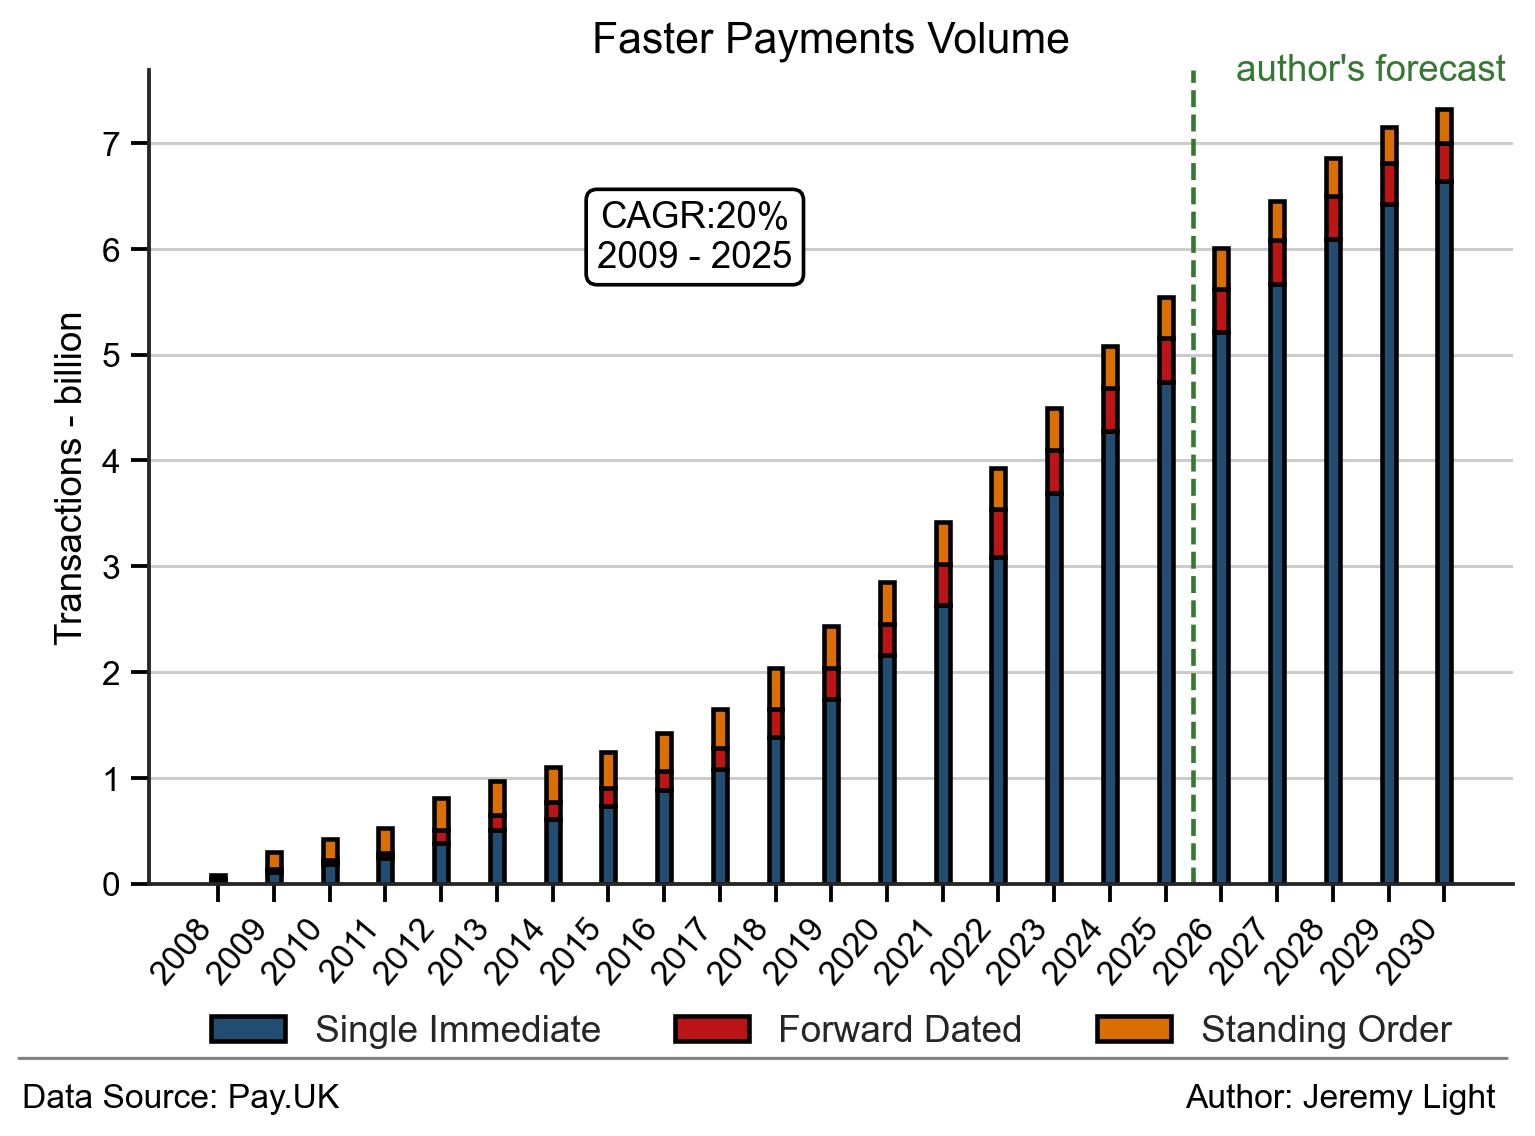
Figure 1 – Faster Payments volumes per payment type (excluding returns)
FDPs were also adopted strongly. In volume terms they are comparable to SOPs, with a similar level of volume since 2021. However, in value terms FDPs are much higher value on average than SIPs and SOPs, accounting for 26% of value in 2025 (7% by volume), indicating their extensive use in business payments.
Figure 2 shows the growth of value processed (adjusted for inflation) by payment type, with a forecast to 2030, again dominated by SIPs followed by FDPs. Since 2009, total FPS values (inflation adjusted) have grown at a CAGR of 22%. The SIPs component has a CAGR of 24%.
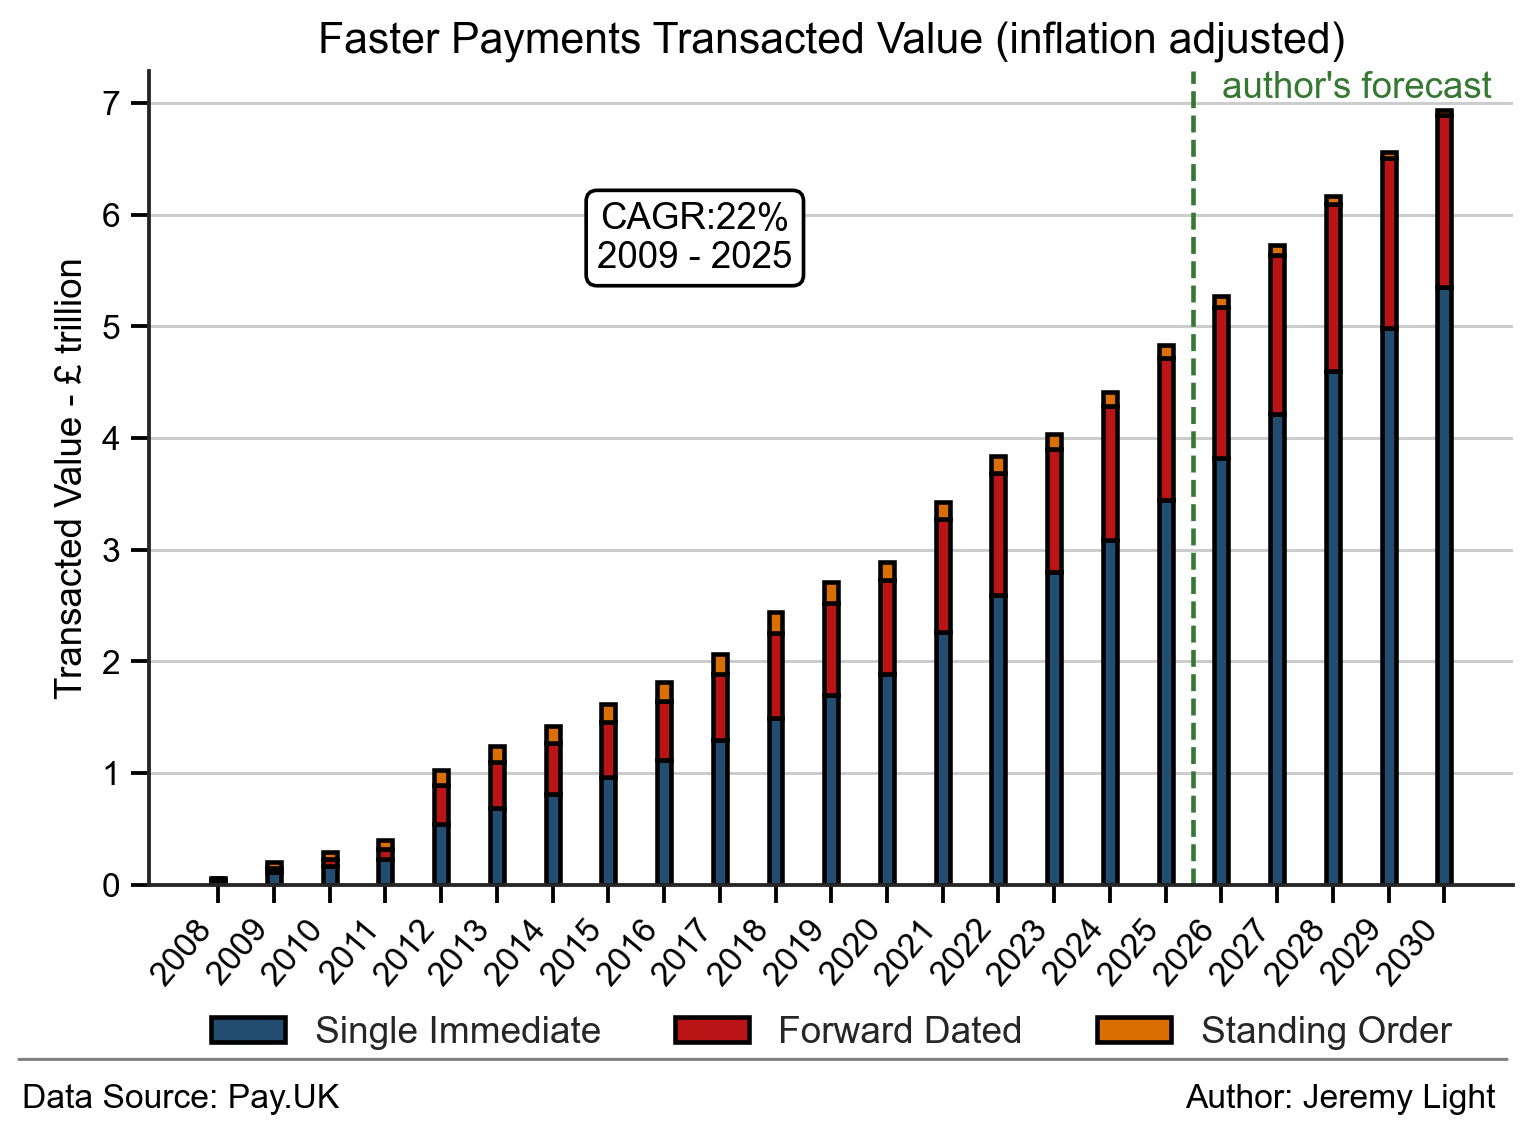
Figure 2 – Faster Payments transacted value by payment type (excluding returns)
Figure 2 shows a jump in value in 2012 from £402bn to £1trn (inflation adjusted to 2025 – or, in nominal terms, from £235bn to £618bn), also seen, less pronounced, in volume terms in Figure 1. This was due to the first Payment Service Directive (PSD – implemented as the PSR 2009 in the UK) which came into force on 1 Jan 2012. It required all payments to be cleared on the receiver’s account by the end of the next business day at the latest. The only practical way for UK banks to achieve this was to use FPS, causing a strong rise in FPS volume and value that year.
The scale of this rise can be seen in Figure 3 which shows the SIP annual volume growth rates.
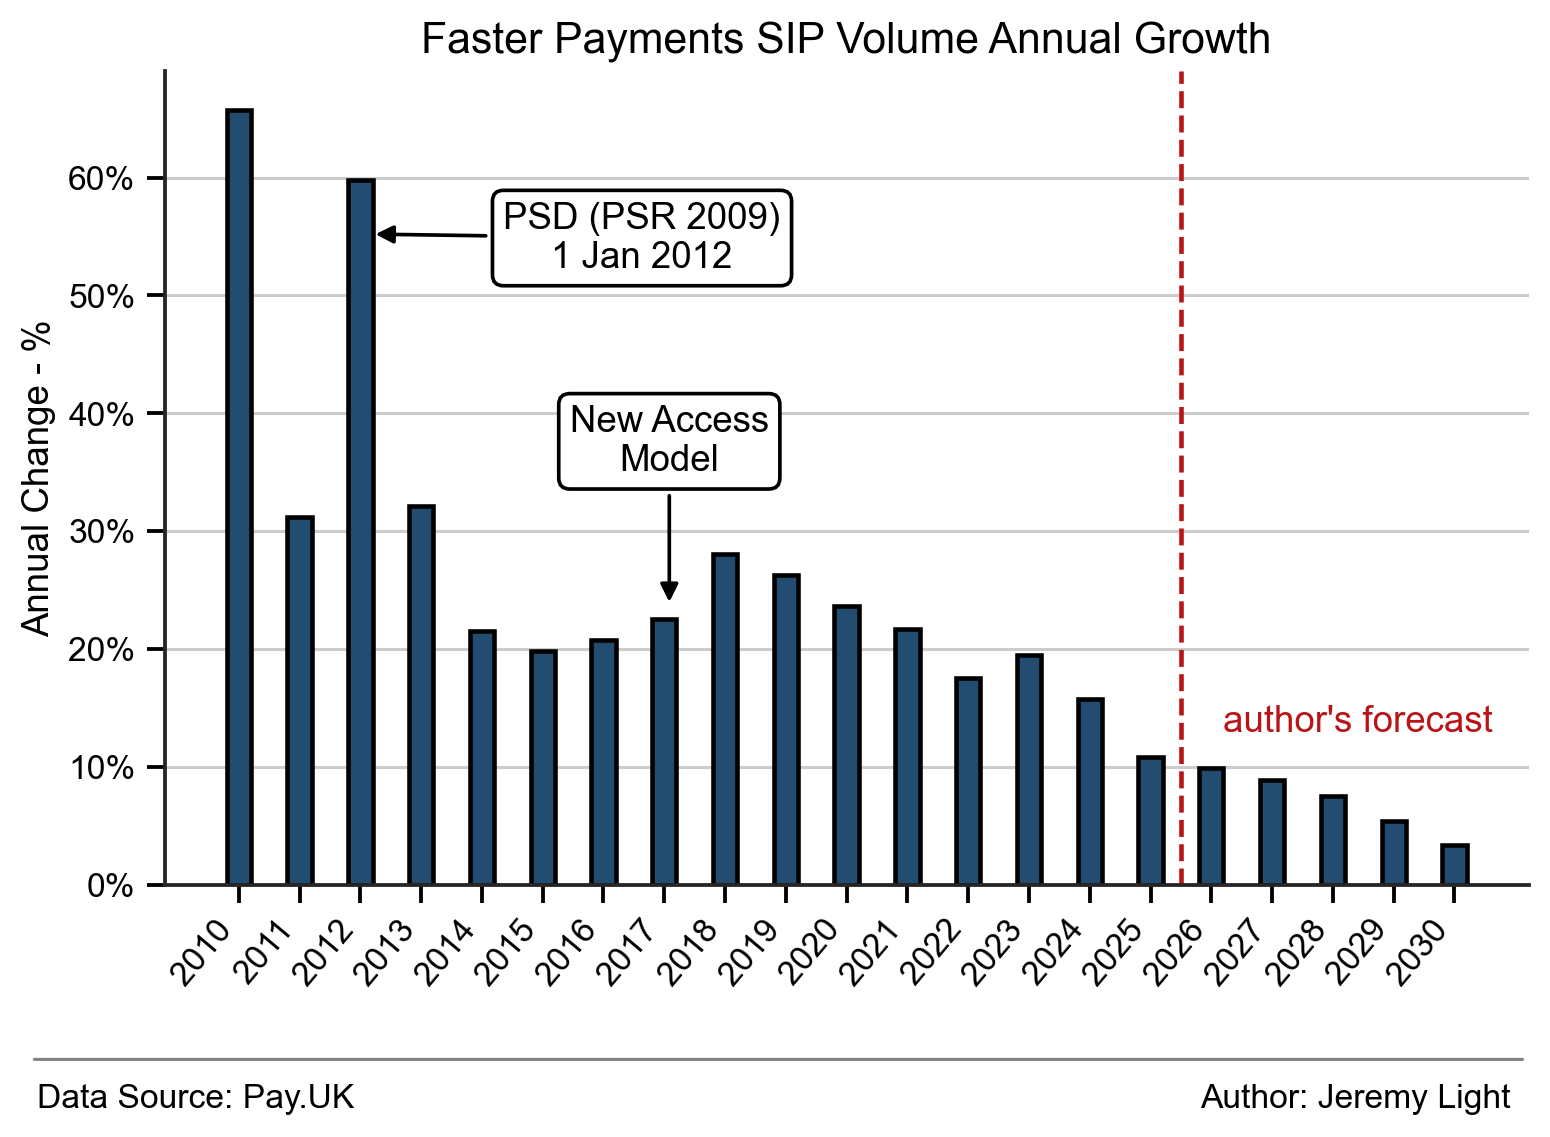
Figure 3 – Faster SIP annual volume growth rates
Figure 3 shows that after the initial high growth of the early years, SIP volume growth spiked in 2012 to 60% due to the PSD, followed by a second smaller spike of 28% in 2018. This second spike was due to the New Access Model which started in 2015, drawing in and enabling new entrants, particularly in 2017 and 2018, that have contributed significantly to SIP volume growth. New banks included Clearbank, Monzo and Starling and new EMIs included Revolut (now a bank) and Transferwise (now Wise). These new banks and EMIs recognised the importance of real-time payments to their digital propositions and have been core drivers of SIP growth.
Overall, SIPs annual growth is on a downward trend and is likely to become pedestrian by 2030 unless FPS (or any successor) is used to support new sources of payments, for example account-to-account retail transactions at POS and ecommerce. Open banking is the great hope for this but has yet to ignite. It started in 2018 and has gradually gained traction but with 351m (mainly SIP) payments in 2025, it accounted for just 7% of SIPs volume last year and has still to make a big difference to SIP volume growth.
Average Transaction Values
The average FPS transaction value was £872 in 2025. This is far above the average credit card and debit card transaction of between £30 and £50, highlighting that FPS is little used in retail9 payments at the moment.
Average transaction values (inflation adjusted) of the different payment types are shown in Figure 4. In 2025, SIPs averaged £727, SOPs £297 and FDs £3,068 per payment. The increase in transaction limits (to £100k in 2010, £250k in 2015 and £1m in 2021) appears have had no measurable effect on these average values.
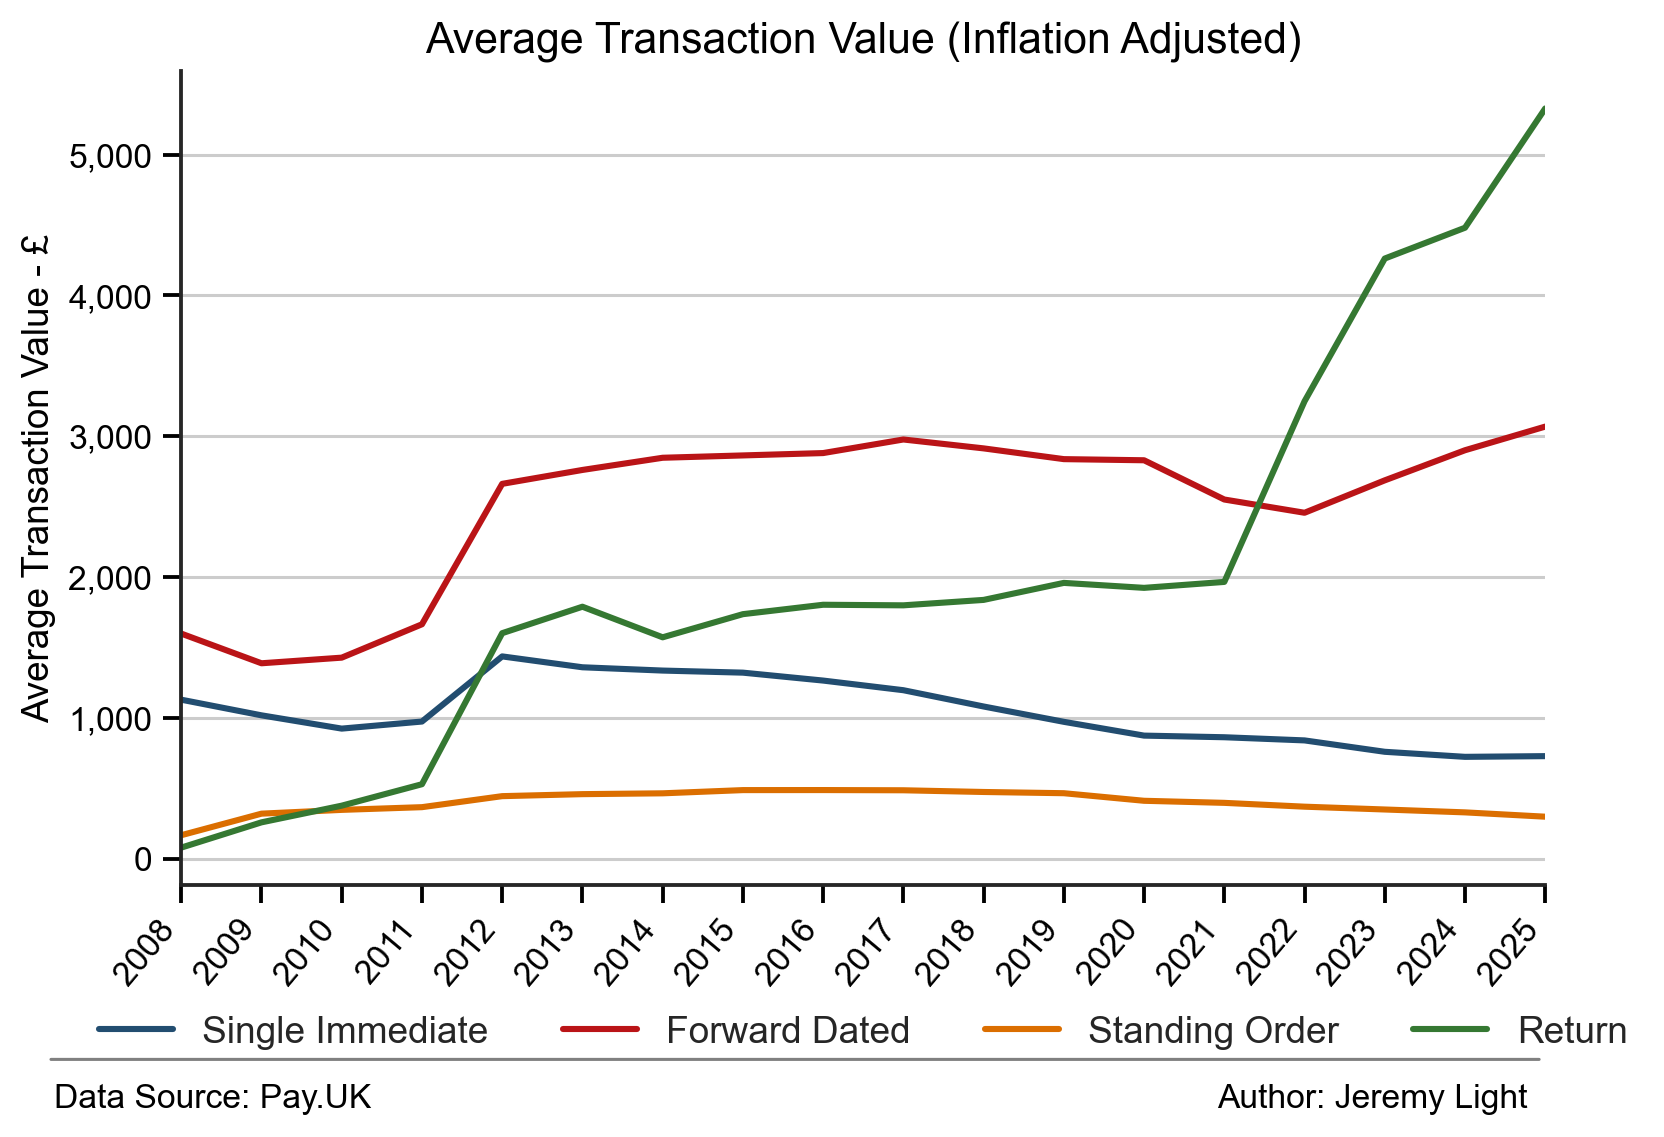
Figure 4 – Faster Payments payment type average transaction value by year (adjusted by RPI)
The average transaction value of returns has been above that for SIPs and SOPs for some time and for some reason started to rise rapidly after 2021, reaching £5,329 in 2025. It is possible that returns are concentrated in FDPs which have much higher transaction values. The increase of the limit to £1m in 2021 could be a reason but seems unlikely given the extra care normally taken when paying large values.
Figure 5 shows that the volume of returns as a proportion of SIP and FDP payments volumes stood at just over 0.1% in 2025 and has reduced steadily from a high of almost 0.5% in 2009. Probably, this reflects the steady strengthening of bank controls over time, reducing the incidence of cleared but unapplied payments. It also suggests that the proportion of payments from/to indirect participants with non-real time connections has fallen substantially over time.
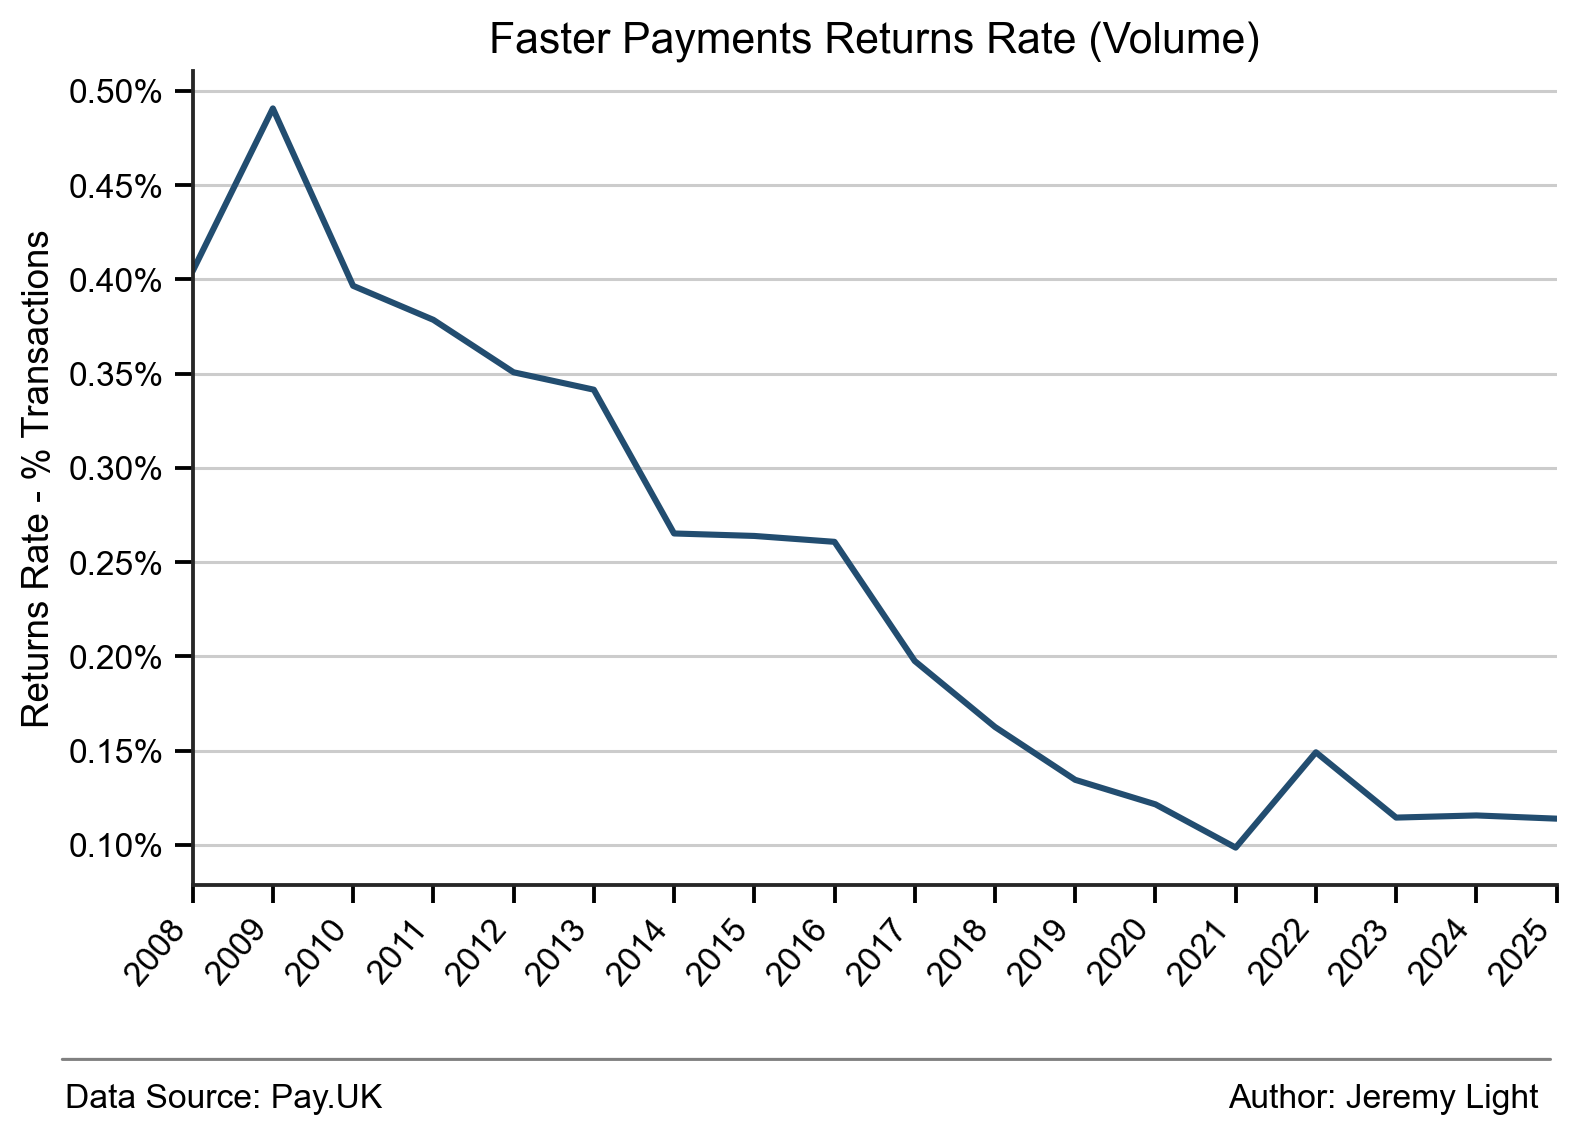
Figure 5 – percentage of SIP and forward dated transactions that lead to a return
FPS Transaction Capacity
A key strength of FPS is its versatility, supporting different transaction types, submitted as single or bulk transactions, synchronous and asynchronous. To illustrate, assuming 51% of SIPs are paid during business hours and that, say 75% of SOPs are processed in the same two hour window overnight, the average throughput measured as transactions per second (TPS) can be estimated easily for each year of operation, as illustrated in Figure 6.
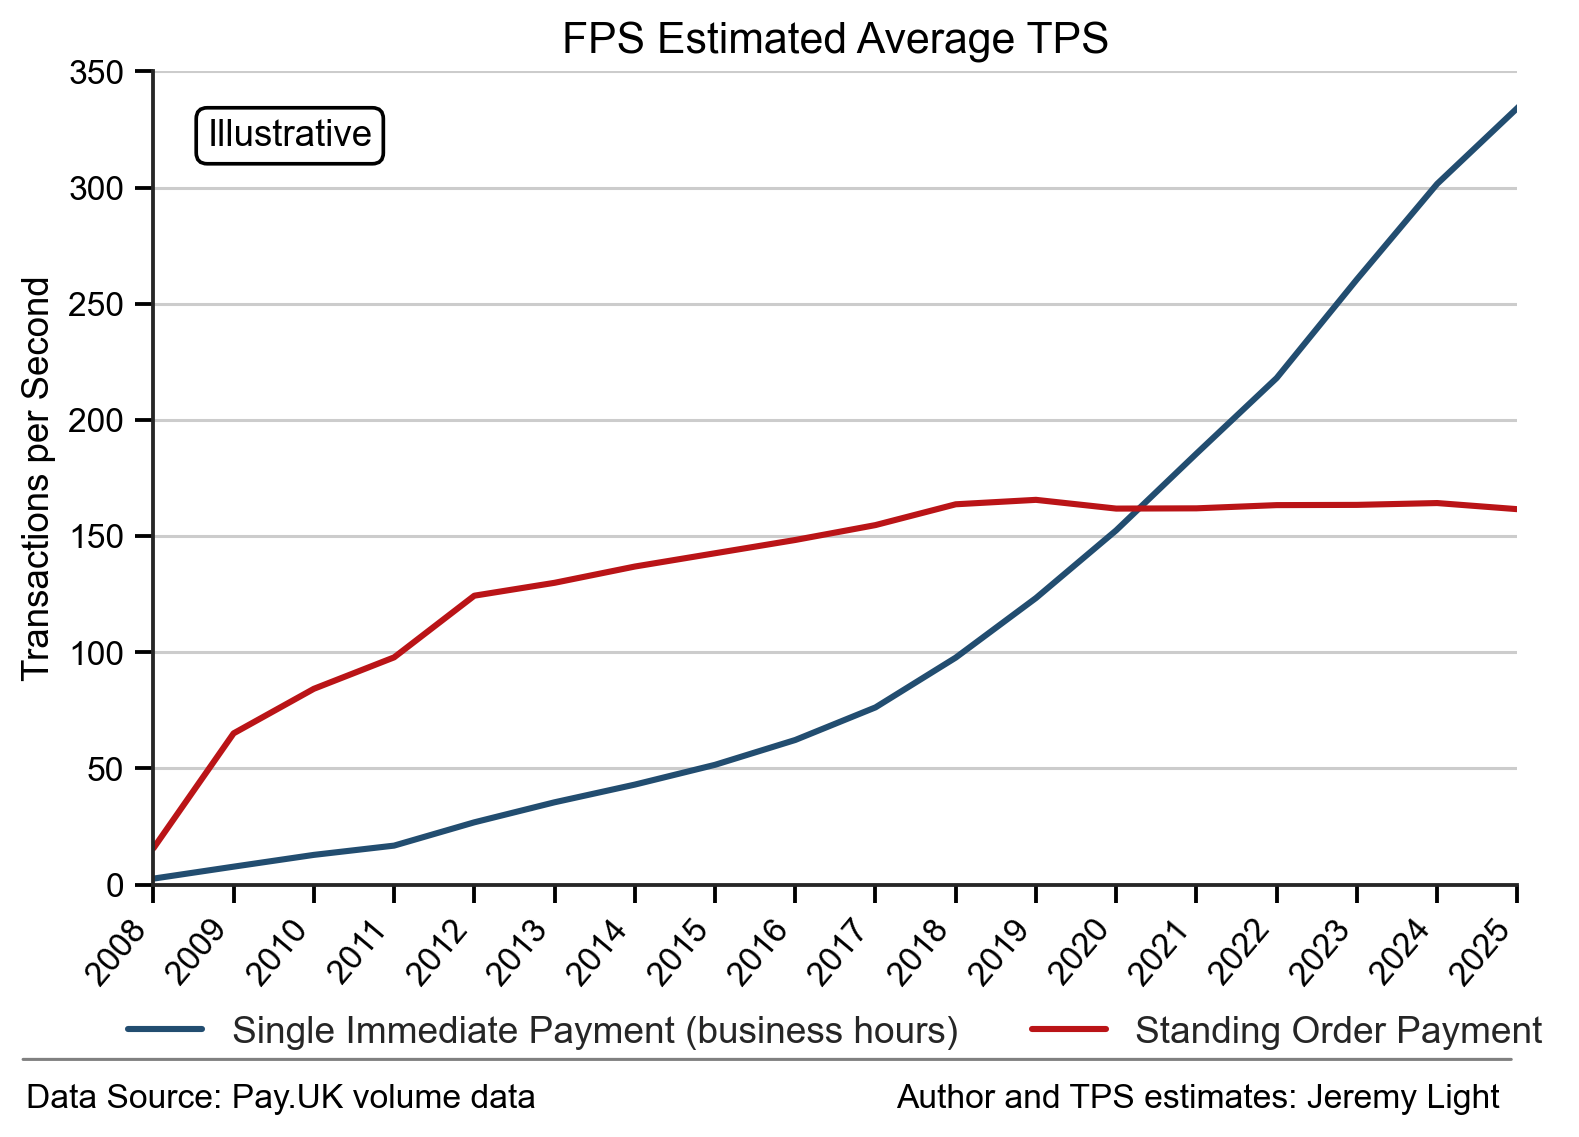
Figure 6 – estimates of average FPS transactions per second based on published transaction volumes
Figure 6 shows that on average the TPS capacity required for SOPs was much higher than for SIPs until around 2020, even though SOPs volumes are much lower than SIPs – due to the much tighter window for processing SOPs. As a result, SOPs have forced FPS to have more TPS capacity than it needed for SIPs in the first 10 years or so, which has contributed to FPS’s resilience and reliability.
It is also worth noting the relatively modest figure of 350 TPS in 2025. This is only a very approximate average and there will be peaks requiring much higher TPS. However, it is far below the TPS required by card networks which can run into 1,000s, illustrating how FPS has room to scale to a considerably higher capacity if required.
Conclusion
From the start, instant payments were in strong demand. FPS volumes were driven initially by SOPs, standing orders migrated from BACS but soon immediate payments, SIPs, took over. In value terms, SIPs overtook SOPs in 2009 and in volume terms, in 2012.
By 2015 it became obvious that real-time payments were a prerequisite for modern bank accounts and online/mobile banking, just as challengers such as Clearbank, Monzo, Revolut, Starling and Wise made a timely arrival onto the UK banking scene. These challengers benefited significantly from their access to FPS real-time payments.
Growth was boosted in 2012 by the initial PSD regulation and again in 2017/18 by the success of the New Access Model. Overall, FPS has grown at CAGRs of 27% (volume) and 24% (inflation-adjusted value) since 2009 to 5.5bn payments in 2025, with £4.8trn transacted. I forecast these to reach 7.3bn payments and £6.9trn in 2030.
These figures show that FPS is used primarily for relatively high value consumer and business payments – rent, mortgages, bills, payroll etc and has yet to be used at scale for account-to-account retail payments at POS and ecommerce. This may come with open banking but until it does, FPS growth may slow to 5% or lower by 2030.
In total, FPS has processed 38bn payments since launch up to the end of 2025 and £39trn (inflation adjusted) in value. My forecasts suggest it will process another 34bn payments and another £31trn over the next five years to 2030 (including 2026).
FPS has proved to be versatile by being able to process bulk payments submitted in batch to its central infrastructure as well as processing single real-time payments. This architecture has allowed FPS to fit into the legacy payments landscape and has made it easier for banks to absorb real-time payments into their operations.
FPS’s versatility together with its reliability have unleashed real-time payments into the UK and into the world and is a key reason why FPS is still around today.
18 years of sustained product-market fit, a huge achievement.
Jeremy Light
Huge thanks to Jeremy Light for allowing Payments:Unpacked to feature 18 Years of UK Faster Payments transactions plus forecasts to 2030 as a guest blog.
Be sure to subscribe to Jeremy’s excellent Agenda: Payments newsletter at:

Payment Infrastructure (NewRPI) — but will it be the phoenix our industry needs? As the journey to a NewRPI commences we’ll be bringing insights, analysis, and conversations on the future of payments infrastructure in the United Kingdom.
Free from corporate or regulatory agendas, who is better placed to lead the discussion on the NewRPI than Mike Chambers — the driving force behind NewBacs, Faster Payments adoption and part of the original NewCHAPS journey.