Weekly ATM value and volume figures 6 March 2022
The volume of ATM transactions increased by 3% when compared to the previous week in 2022.
The volume of ATM transactions increased by 21% when compared to the equivalent week in 2021.
The volume of ATM transactions decreased by 29% when compared to the equivalent week in 2020.
On average we all withdrew £1,500 from cash machines last year
Cash is still vital to so many people, millions of people are choosing new ways to pay but, last year, on average, every adult in the UK still withdrew almost £1,500 from cash machines across the country.
Nick Quin, head of financial inclusion at Link.
Let’s explore the UK’s weekly, daily and monthly cash acquisition habits….
Weekly LINK ATM transaction volumes
Last week there was a total of 31.1 million ATM transactions which represents anincrease of 0.8 million ATM transactions over the previous week.
In 2022, there was an increase of 5.5 million transactions or 21% when compared with the equivalent week in 2021.
After the usual seasonal fall at the end of December and a slow start to January, activity in 2022 had pulled away from 2021 as expected given the Lockdown restrictions last year. The last two weekends have bounced back after the impact from Storm Eunice and ATM Transaction volumes have now returned to more expected levels.
The graph above shows the impact on ATM Transactions throughout the first year of lockdowns in 2020 and initially at the beginning of 2021 with Lockdown 3.0. This was followed by a gradual increase in volumes in 2021 as restrictions eased throughout the Summer.
From the Summer months onwards activity across both 2020 and 2021 was very closely matched with the exception of the comparison with Lockdown 2.0 in November 2020. The usual seasonal fall at the end of December is clearly evidenced in the graph below which follows a usual pattern that can also be seen in 2020 and 2019.
After a slow start to January, the volume of ATM transactions in 2022 continues to track above 2021 although overall volumes remain below pre-pandemic levels.
The graph below also shows the trajectory of ATM Transactions with the graph also showing the timing of each lockdown and the differing level of restrictions in place.
Conditions were at their closest over the two years over the Summer with hospitality re-opening at the beginning of July 2020 and with businesses operating under similar restrictions to those currently in place in 2021. The convergence of the graphs shows a consistent level of ATM transactions and value across the two years under these similar conditions.
The two graphs diverged as conditions differed during November but have now converged again as similar restrictions were in place across the two years with both years showing the usual seasonal reduction in volumes at the end of the year.
For the current year transactions can clearly seen to be increasing throughout January and the beginning of February.
In the latest report by LINK published on 4 March 2022, LINK research shows how cash habits have changed through the pandemic. By the end of January 2022, in England, the Government announced an end to Plan B measures. This was the first time LINK conducted the research since summer 2021 and it showed the number of consumers using cash in the last two weeks has now increased to 73%, the highest-level LINK has recorded during the pandemic.
The research also showed a change in where people are using cash. Locations which are showing increasing usage are supermarkets, other retail, services like hairdressing and most especially pubs. This may be a result of those locations starting to accept cash once again, or at least not actively discouraging it. Locations which have shown very little change are convenience stores (by far the most popular location throughout), fuel, DIY stores and parking.
Assuming conditions this year remain unchanged from now on, we would expect the 2021 and 2022 graphs to merge again around May when restrictions were lifted in 2021.
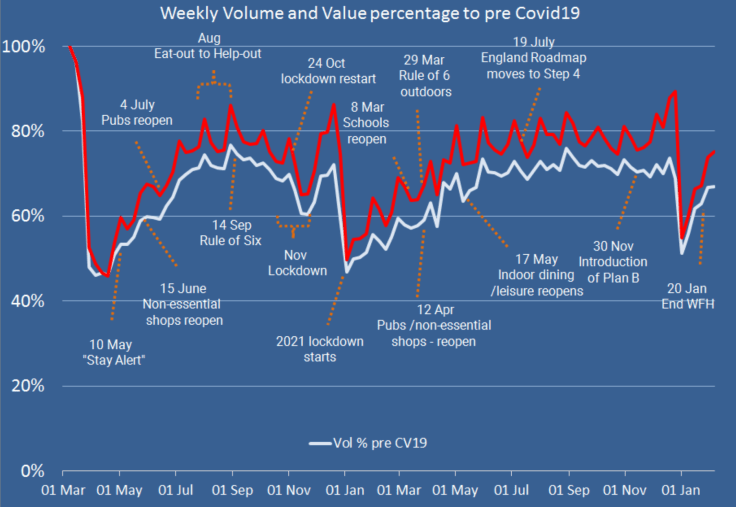
The overall volume and value of transactions had been very subdued throughout each of the Lockdowns compared to pre-pandemic levels as shown in the next graph below. This graph shows the pattern as restrictions began to be eased. Both volumes and values are recovering from the seasonal fall and Plan B restrictions with volumes at the time the graph was produced at around 68% and values around 75% of pre-pandemic levels.
Daily LINK ATM transaction volumes
The graph for Mondays below shows the similarity in the pattern of transactions with 2022 above the Lockdown levels at the beginning of 2021 but well below the early pre-pandemic months in 2020.
Keep reading with a 7-day free trial
Subscribe to Payments:Unpacked to keep reading this post and get 7 days of free access to the full post archives.


